Once the evaluation is completed the data undergoes artifacting, which involves the professional indicating which epochs (one second period of time) are affected by artifacts (eye movements, muscle activity, etc.) and thus cannot be considered in the analysis.
The software generates the subject’s values for all of the administered tasks. Then the subject’s values on all the tasks and all the variables are examined in terms their standard deviation difference from a normative database.
The concept of standard deviations is a basic concept in statistical analysis. The attached page presents the basic concept. A subject’s value on a variable can be described in terms of its difference from the normative reference group in terms of standard deviation units. Although the numbers may appear low, i.e. 1 standard deviation, the value is deceptive. For example, the standard deviation of weight is 30 pounds. So if a subject is “only” 1 standard deviation above the normative value, he / she is 30 pounds heavier than the normative value.
Dr. Thornton examines the data for all conditions and determines the priority of the interventions, based upon the research he has conducted and his understanding of the neuroscience of brain functioning.
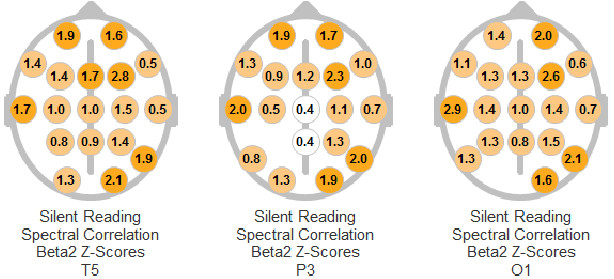
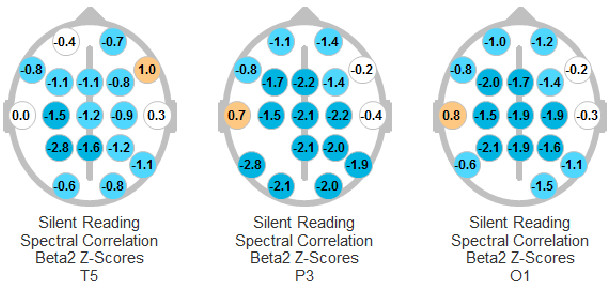
In the head figures where there is one location with no circle, the empty location represents the origin of a “flashlight” which “sends” out its beam to the other locations. When the beam arrives at a particular location a coherence value (or phase) is calculated. The colors of the circle indicated the standard deviation (SD) difference from the normative reference group. The white color indicates that the subject was within the range between +.50 and -.50 standard deviations. The light blue indicates the subject was between -.50 and -1.50 SD. The dark blue indicates the subject’s value was below -1.50 SD. Light orange indicates the subject was between +.50 SD and +1.50 SD while the dark orange indicates a value above +1.50 SD. The number in the circle is the SD value. The figure below represents an individual who had experienced a significant head injury. The values in the circles represent the SD value difference from the normative reference group. The subject is reading in this example.
The figure below is for comparison purposes. It presents the qEEG results for a high functioning individual engaged in the reading task. The values in the circles represent SD values.