QEEG maps of individuals in pain
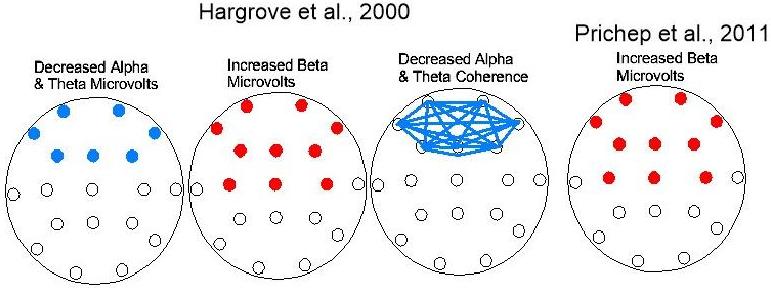
Blue: indicates below normal values Red: indicates above normal values
Based on Z-statistic findings, the EEGs from FM subjects differed from matched controls in the normative database in three features: (1) reduced EEG spectral absolute power in the frontal International 10-20 EEG measurement sites, particularly in the low- to mid-frequency EEG spectral segments; (2) elevated spectral relative power of high frequency components in frontal / central EEG measurement sites; and (3) widespread hypocoherence, particularly in low- to mid-frequency EEG spectral segments, in the frontal EEG measurement sites. A consistent and significant negative correlation was found between pain severity and the magnitude of the EEG abnormalities.
 Reference: Quantitative Electroencephalographic Abnormalities in Fibromyalgia Patients, Jeffrey B. Hargrove, Robert M. Bennett, David G. Simons, Susan J. Smith, Sunil Nagpal and Donald E. Deering, CLINICAL EEG and NEUROSCIENCE ©2010 VOL. 41 NO. 3
Prichep, L.S., John, E.R., Howard, B., Merkin, H., Hiesiger, E.M. (2011). Evaluation of the pain matrix using EEG source localization: a feasibility study. Pain Med., 12 (8), 1241-8. doi: 10.1111/j.1526-4637.2011.01191