The typical pattern in all anxiety conditions is elevated levels of beta activity, as indicated in the figure below. The numbers in the circles represent standard deviation values. The beta2 frequency is defined as 32-64 Hertz while the theta frequency is defined as 4-8 Hertz.
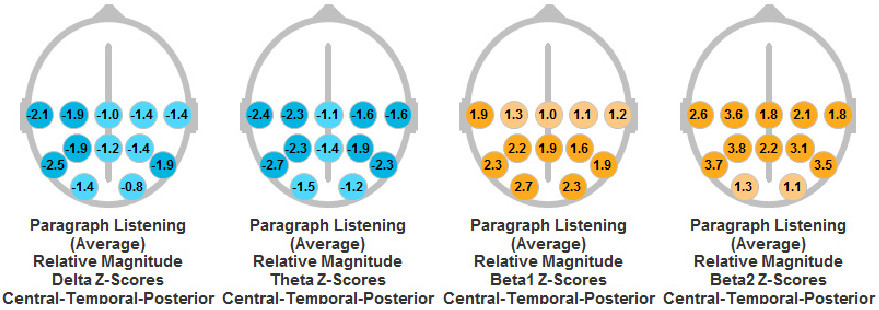
Color coding is provided to indicate standard deviation differences from a normative reference group. If the circle is white, the value is within +/- .50 Standard Deviation (SD) Units. If the circle is light blue, then the value is between -.50 SD and -1.50 SD. A darker blue is assigned to those values which are greater than 1.5 standard deviation below normative value. If the value is .50 SD above the normative value, the light color orange is employed. A darker orange color is employed for those values which are greater than 1.5 SD above the norm. The numbers in the circles represent the standard deviation value for the individual.